
August - Is The Vancouver Real Estate Market Still Looking Up?
If the title did not give it away, the statistics are in and we know how well the market performed in Vancouver Real Estate in August!
The question on everybody's mind? Was July just a dead cat bounce.....? (Forgive us, we hate the expression, but we did not choose it!)
Overall it was a very good month for the market. We cannot express the importance of checking your specific areas of interest, both geographical area and product, as the overarching story can be quite different. For example, when looking at Metro Vancouver homes as a whole, newly listed properties in August 2018 vs. August 2019 decreased by -3.5%.
Well Vancouver’s Westside Detached market saw a decrease in the same time frame of -24.55% for new listings. It always pays to do your research or work with a Realtor who does, that could be the difference in success vs failure in this market.
Although August 2019 was below the 10 year average by 9.2%, it was quite an increase in Home Buyer demand vs August 2018. In fact it was a 15.7% increase from this time last year when discussing sales. On top of this, inventory seems to be continually decreasing.
August is usually a slow month in the market as people gear up to attack in the upcoming fall market. So the fact the numbers increased vs 2018 for a second month in a row is very positive news. With sales to active ratios sitting at 16.7% as a blended rate, we’re gearing up for a buoyant market which will see sales and pricing level out. Once again confirming that we have reached the bottom of the market. When breaking these numbers down into categories, Apartments have a sales to listing ratio of 21.2%, with detached homes sitting at 12%.
According to the Real Estate Board of Greater Vancouver, upwards pressure on pricing seems to take place when these ratios sit above 20% for a sustained period of time. This is the second month apartments have been above 20%. The reverse happens when the ratio sits below 12% for a sustained period of time.
Disclaimer, the below table is focusing on the city of Vancouver, NOT Metro Vancouver as a whole. Our numbers are purely focused on Vancouver’s East and West Side, so when doing your own research, make sure to bear this in mind.
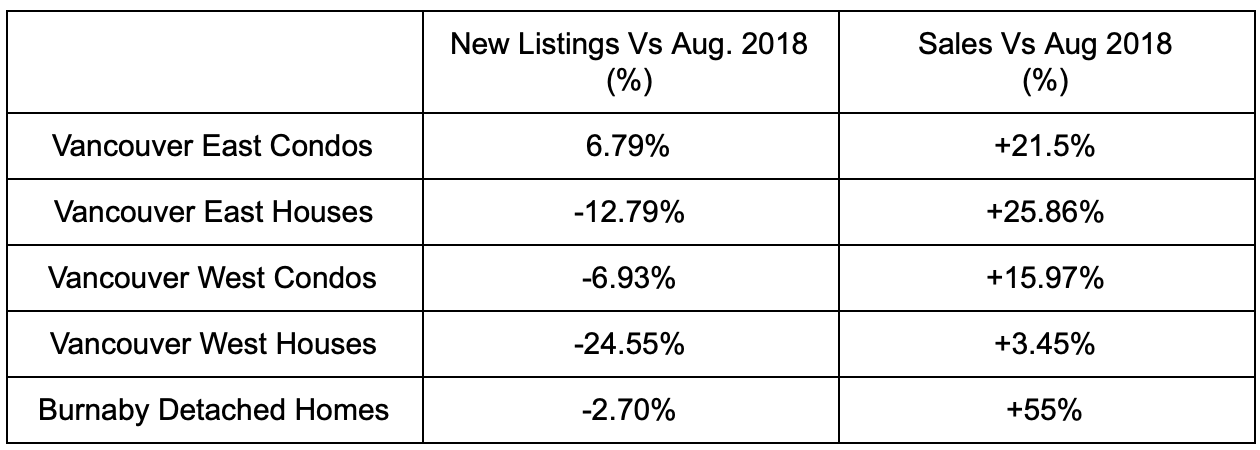
Not untypical to see Vancouver leading the way when it comes to the increase in sales vs the rest of the Metro area. Typically everything else tends to follow suit. Once condos have adjusted and sales start picking up, that seems to take pressure off the housing market too.
Burnaby has gone through a huge change over the last year, with detached home sales up by 55%.
It’s important to remember this market change, should it continue on this trajectory is not an indicator prices are going to start soaring again. Rather that we have hit bottom and product will continue to move, as opposed to slow down even further. Evidence of this has already been seen with minimal adjustments to the Home Price Index (HPI) of just -0.2% from July 2019. This reduction in HPI has been declining as the year has progressed with June being -0.8%, July being -0.3%.
We appreciate you reading and joining us every week! Let us know what YOU want covered in our blogs so we can get you what you need!
Until next week,
Mcinnes Marketing Out!
If the title did not give it away, the statistics are in and we know how well the market performed in Vancouver Real Estate in August!
The question on everybody's mind? Was July just a dead cat bounce.....? (Forgive us, we hate the expression, but we did not choose it!)
Overall it was a very good month for the market. We cannot express the importance of checking your specific areas of interest, both geographical area and product, as the overarching story can be quite different. For example, when looking at Metro Vancouver homes as a whole, newly listed properties in August 2018 vs. August 2019 decreased by -3.5%.
Well Vancouver’s Westside Detached market saw a decrease in the same time frame of -24.55% for new listings. It always pays to do your research or work with a Realtor who does, that could be the difference in success vs failure in this market.
Although August 2019 was below the 10 year average by 9.2%, it was quite an increase in Home Buyer demand vs August 2018. In fact it was a 15.7% increase from this time last year when discussing sales. On top of this, inventory seems to be continually decreasing.
August is usually a slow month in the market as people gear up to attack in the upcoming fall market. So the fact the numbers increased vs 2018 for a second month in a row is very positive news. With sales to active ratios sitting at 16.7% as a blended rate, we’re gearing up for a buoyant market which will see sales and pricing level out. Once again confirming that we have reached the bottom of the market. When breaking these numbers down into categories, Apartments have a sales to listing ratio of 21.2%, with detached homes sitting at 12%.
According to the Real Estate Board of Greater Vancouver, upwards pressure on pricing seems to take place when these ratios sit above 20% for a sustained period of time. This is the second month apartments have been above 20%. The reverse happens when the ratio sits below 12% for a sustained period of time.
Disclaimer, the below table is focusing on the city of Vancouver, NOT Metro Vancouver as a whole. Our numbers are purely focused on Vancouver’s East and West Side, so when doing your own research, make sure to bear this in mind.
Not untypical to see Vancouver leading the way when it comes to the increase in sales vs the rest of the Metro area. Typically everything else tends to follow suit. Once condos have adjusted and sales start picking up, that seems to take pressure off the housing market too.
Burnaby has gone through a huge change over the last year, with detached home sales up by 55%.
It’s important to remember this market change, should it continue on this trajectory is not an indicator prices are going to start soaring again. Rather that we have hit bottom and product will continue to move, as opposed to slow down even further. Evidence of this has already been seen with minimal adjustments to the Home Price Index (HPI) of just -0.2% from July 2019. This reduction in HPI has been declining as the year has progressed with June being -0.8%, July being -0.3%.
We appreciate you reading and joining us every week! Let us know what YOU want covered in our blogs so we can get you what you need!
Until next week,
Mcinnes Marketing Out!
Jay Mcinnes
T: 604.771.4606
jay@mcinnesmarketing.com
Ben Robinson
T: 604.353.8523
ben@mcinnesmarketing.com